A Peek into My Debugging Process (With Real Examples)

A native macOS app for App Store Connect that streamlines app updates and releases, making the process faster and easier.
Debugging is a skill that is often overlooked by developers. It is a skill that is not only useful for fixing bugs, but also for improving your understanding of the codebase and the language you build software in.
Especially as we enter the era of AI-assisted debugging, where more often than not, we find ourselves trying to understand the code an LLM has given us or, what’s worse, the bugs it has introduced 😱.
I have been an iOS developer for over 7 years now and, in this time, I have worked on a variety of apps of different sizes and complexity. While the projects have varied in theme and tech stack, the one thing that has remained constant is the need to diagnose and fix bugs.
Being familiar with how to debug an application and being familiar with or even aware of the tools you have at your disposal is a skill that will save you a lot of time and will allow you to move on to the next task faster. This has become essential to me while working on my own indie apps, as I have limited resources and time, and I need to make sure I use it in the most efficient way possible while still putting customer experience first.
In this post, I will share a few examples of real-world bugs I have recently fixed in my apps and walk you through the entire debugging process in each case.
Bug 1: The Crash
One of the most common issues that might require your full attention is a crash.
We recently had a report from a few Helm users stating that our translation feature was crashing as soon as they pressed on the ‘Translate All’ button:
However, we were not able to reproduce the issue on our end, no matter how hard we tried. Fortunately, we had access to the crash logs, so we could investigate the issue further and try to find its root cause.
If you have ever tried to look at a crash log file, you will know that it is not easily readable and it sometimes points to some internal system library with very little or no connection to your actual code. If the latter happens, then it becomes a lot harder to understand what is going on let alone fix the crash.
This is an extract of the stack trace for the crash report:
Thread 0 Crashed::  Dispatch queue: com.apple.main-thread
0   libsystem_kernel.dylib        	       0x199001388 __pthread_kill + 8
1   libsystem_pthread.dylib       	       0x19903a88c pthread_kill + 296
2   libsystem_c.dylib             	       0x198f43c60 abort + 124
3   libsystem_c.dylib             	       0x198f42eec __assert_rtn + 284
4   AppKit                        	       0x19de49ff0 _nsis_frameInEngine + 1608
5   AppKit                        	       0x19de51acc -[NSView(NSConstraintBasedLayoutInternal) systemLayoutSizeFittingSize:withHorizontalFittingPriority:verticalFittingPriority:] + 356
6   SwiftUI                       	       0x1ca5de204 PlatformViewHost.intrinsicContentSize.getter + 264
7   SwiftUI                       	       0x1ca5de0d4 @objc PlatformViewHost.fittingSize.getter + 40
8   AppKit                        	       0x19de51d70 -[NSView(NSConstraintBasedLayoutInternal) measureMin:max:ideal:stretchingPriority:] + 300
9   SwiftUI                       	       0x1ca5decbc PlatformViewHost.intrinsicLayoutTraits() + 384
10  SwiftUI                       	       0x1ca5dc804 PlatformViewHost.layoutTraits() + 608
11  SwiftUI                       	       0x1ca59c848 closure #1 in ViewLeafView.layoutTraits() + 224
12  SwiftUI                       	       0x1ca59c744 ViewLeafView.layoutTraits() + 52
13  SwiftUI                       	       0x1ca59c480 closure #1 in ViewLeafView.sizeThatFits(in:environment:context:) + 1420
14  SwiftUICore                   	       0x200429490 specialized static Update.syncMain(_:) + 84
15  SwiftUI                       	       0x1ca599b8c closure #1 in PlatformViewLayoutEngine.sizeThatFits(_:) + 112
16  SwiftUICore                   	       0x2004d32c4 ViewSizeCache.get(_:makeValue:) + 360
17  SwiftUI                       	       0x1ca599ad4 PlatformViewLayoutEngine.sizeThatFits(_:) + 264
18  SwiftUICore                   	       0x20073ead0 LayoutEngineBox.sizeThatFits(_:) + 144
As you can see, it only contains entries from the SwiftUI and AppKit frameworks, which didn’t really help me much. At this point, I turned to ChatGPT to help me better understand the crash log and to see if it knew more about what could cause a crash in these internal methods.
This is the response I got:
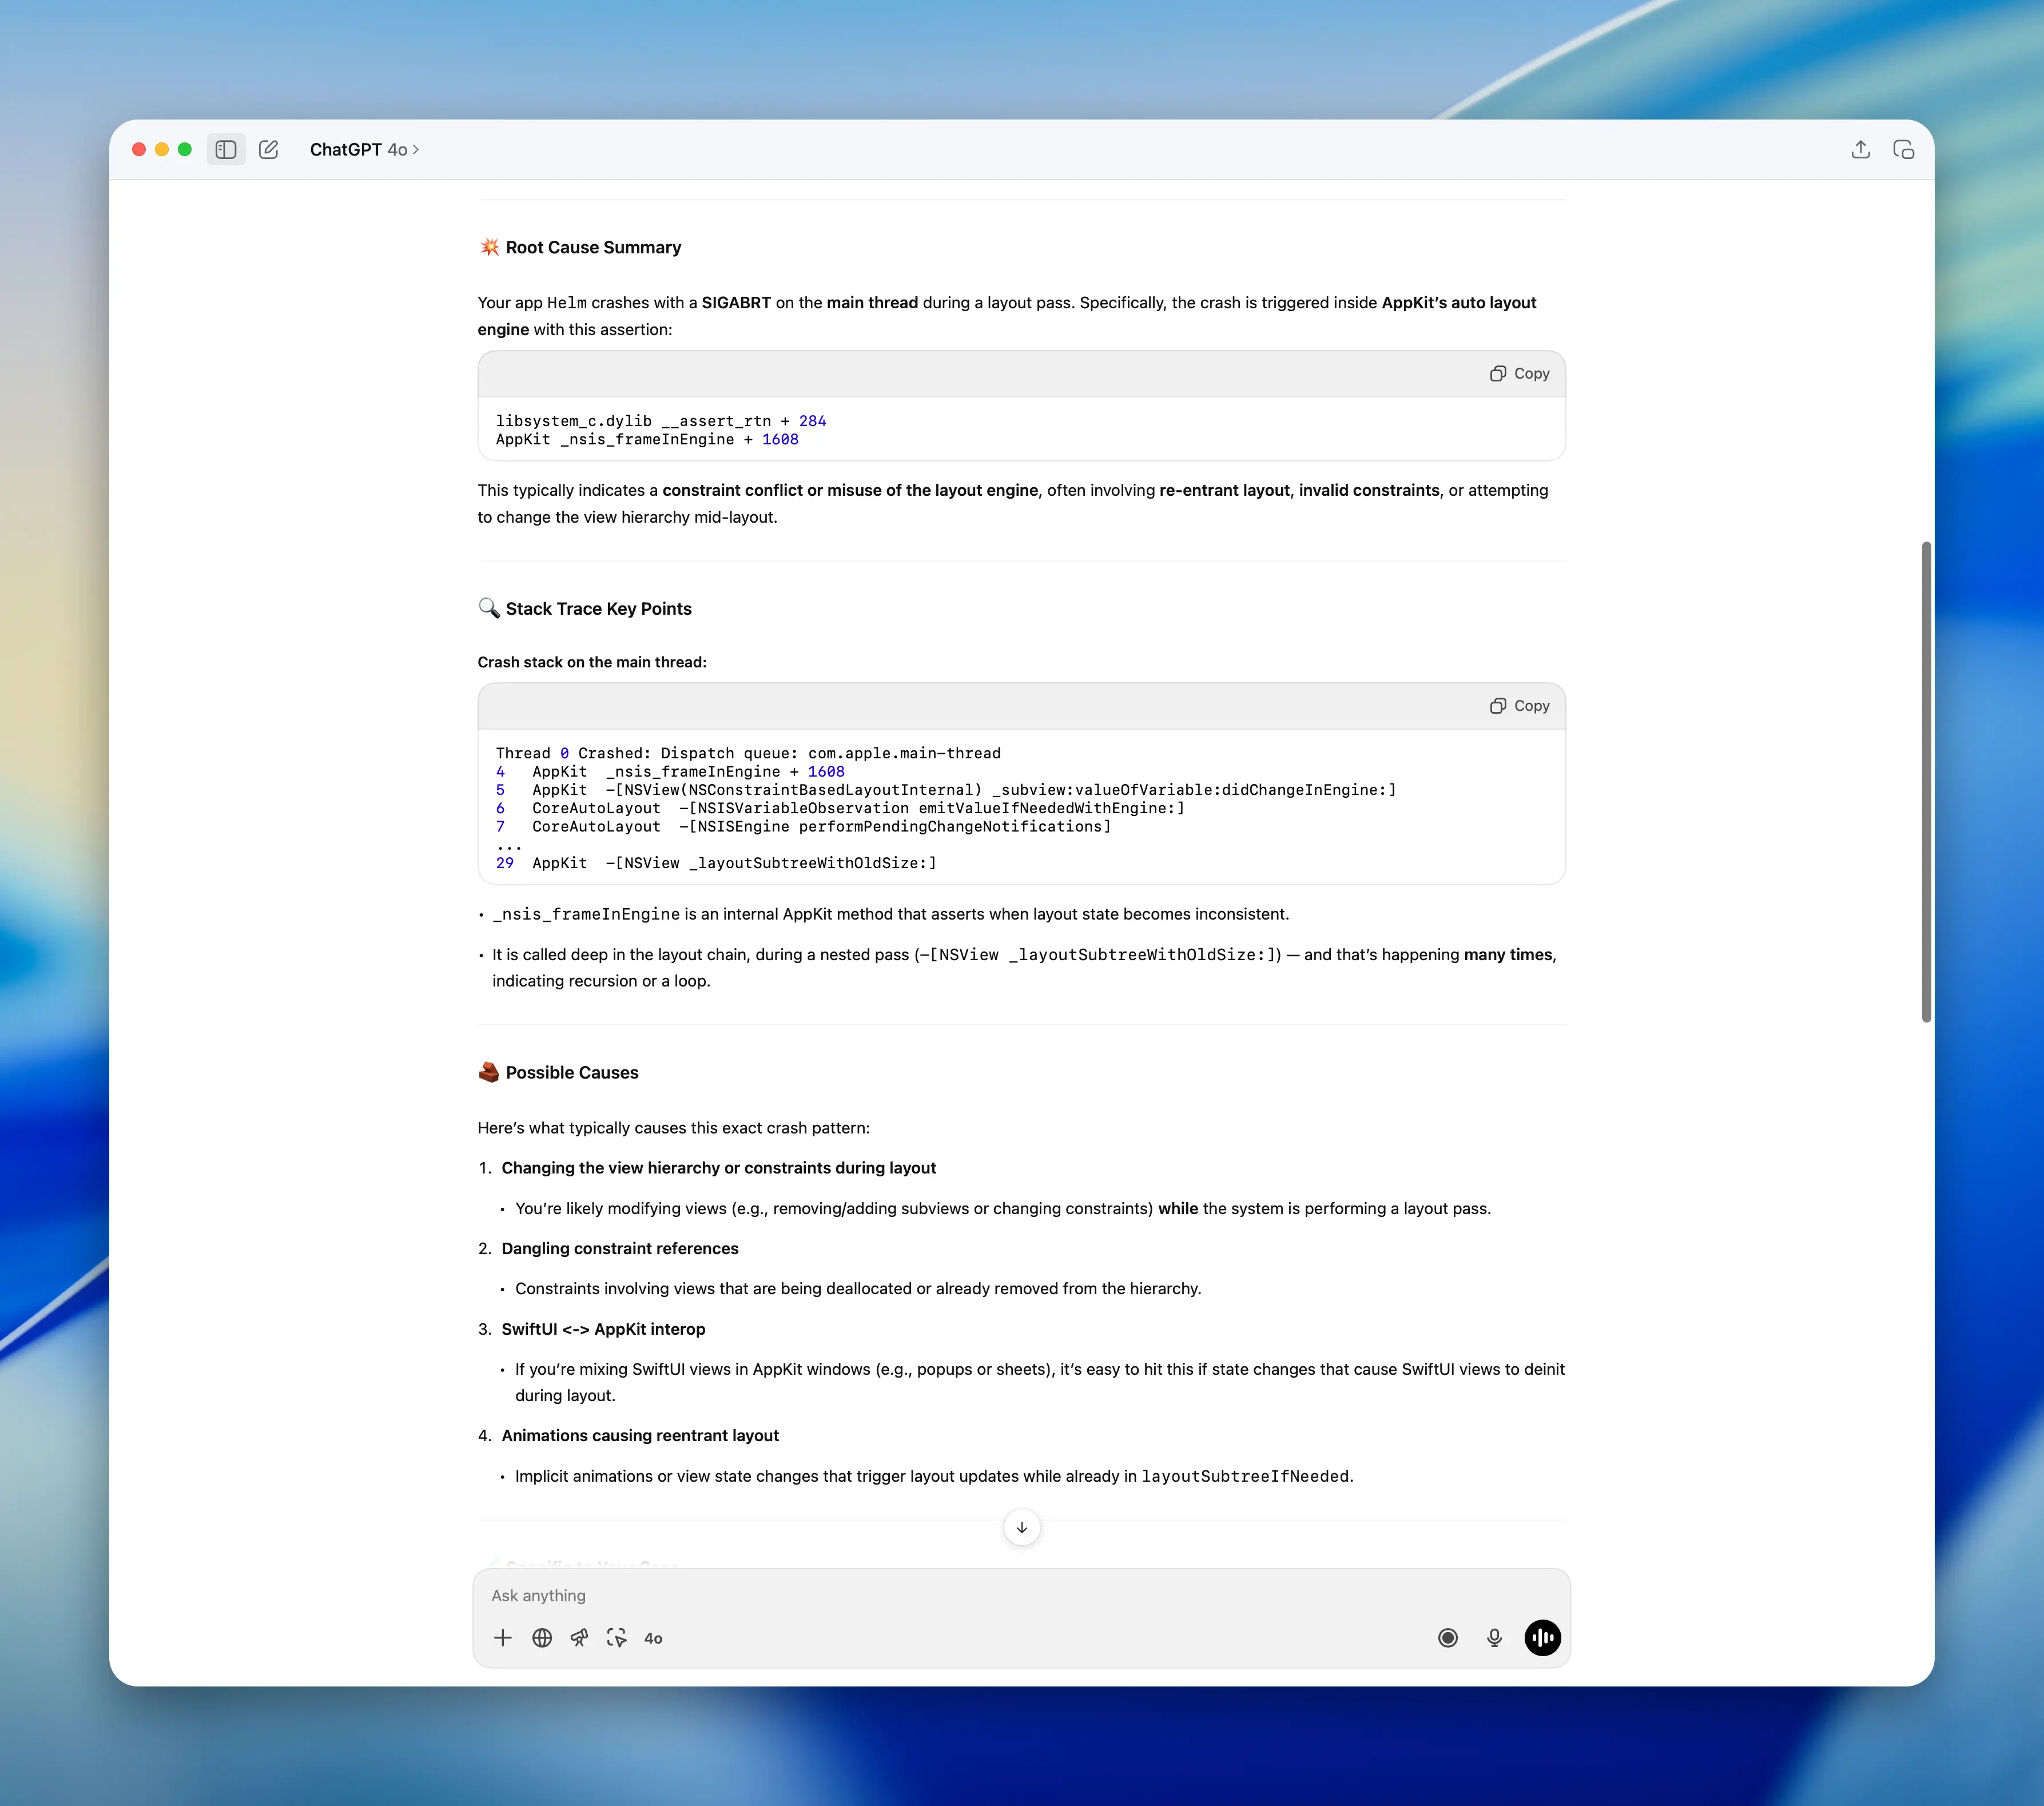
Again, while ChatGPT did not give me the exact cause of the issue, it pointed me in the right direction with this statement: “_nsis_frameInEngine is an internal AppKit method that asserts when layout state becomes inconsistent”. While I wasn’t completely sure what view was causing the issue, I knew that I had to focus my efforts on UI code, and try and figure out what would cause the layout to not be computed correctly.
As I knew from the user’s report that the issue was happening when pressing the ‘Translate All’ button in the translations screen, I now turned to a separate information source to help me further understand the context the crash occurred in: Diagnostics.
If you are not familiar with Diagnostics, it is a brilliant open source library built by Antoine van der Lee that collects a bunch of useful information including logs, network requests, and more from a user’s session in your app and then generates a human-readable HTML report that can be shared with the app’s developers.
In this specific situation, Diagnostics gave us a key piece of information:
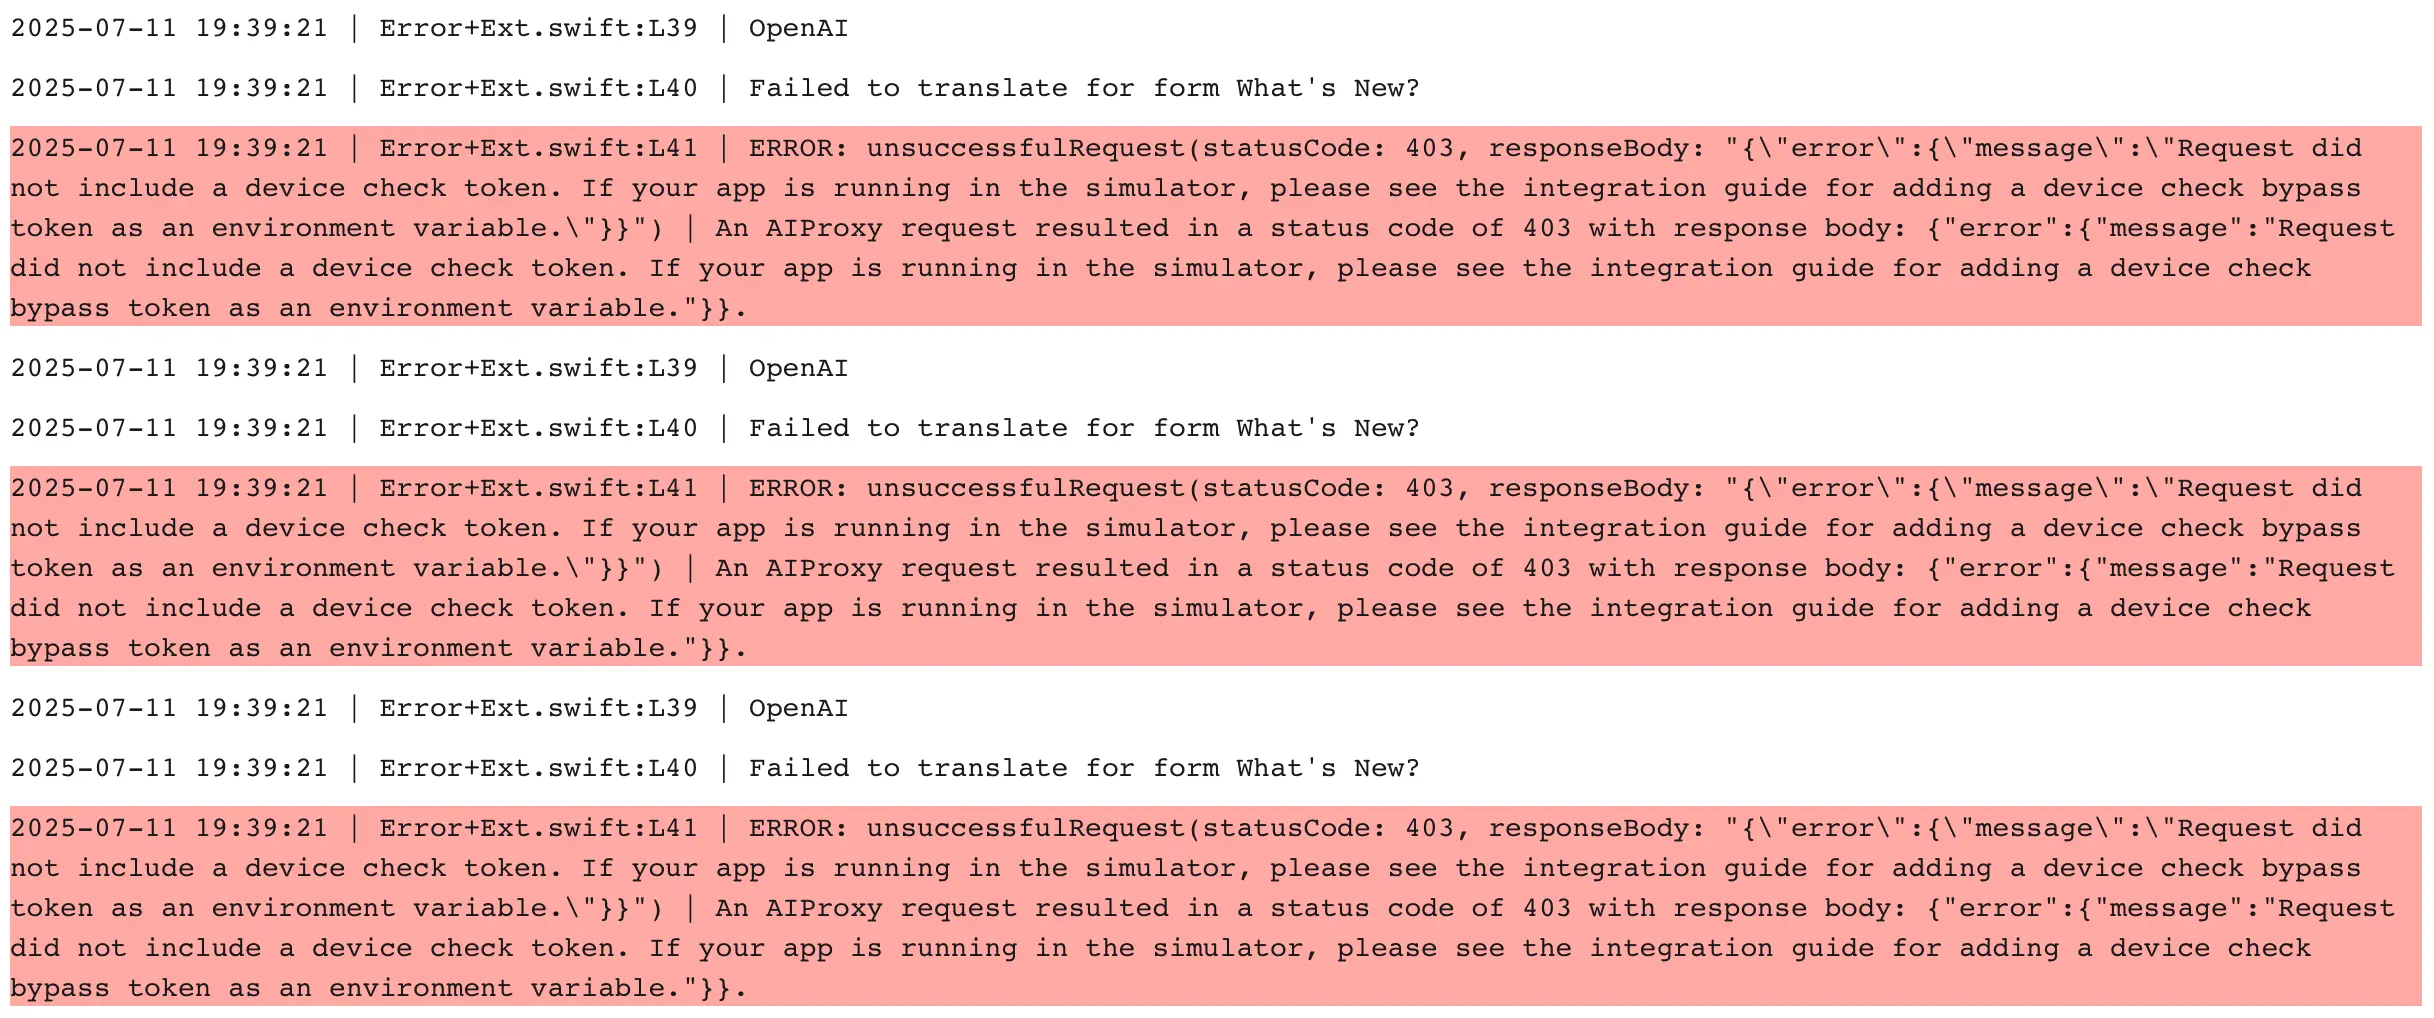
As you can see, the report shows that the network request to translate all content failed right before the crash. Could this explain why we were not able to reproduce the issue on our end? Could it be that the crash only happened when the network request to translate all content failed?
To validate this hypothesis, I turned to the tool that I use the most to debug networking issues (or even to validate my implementation is correct sometimes): Proxyman, a macOS app that allows you to intercept and modify network requests and responses.
I found the translation request the app was making and then added it to the ‘Block List’ in Proxyman to make it fail in the app:
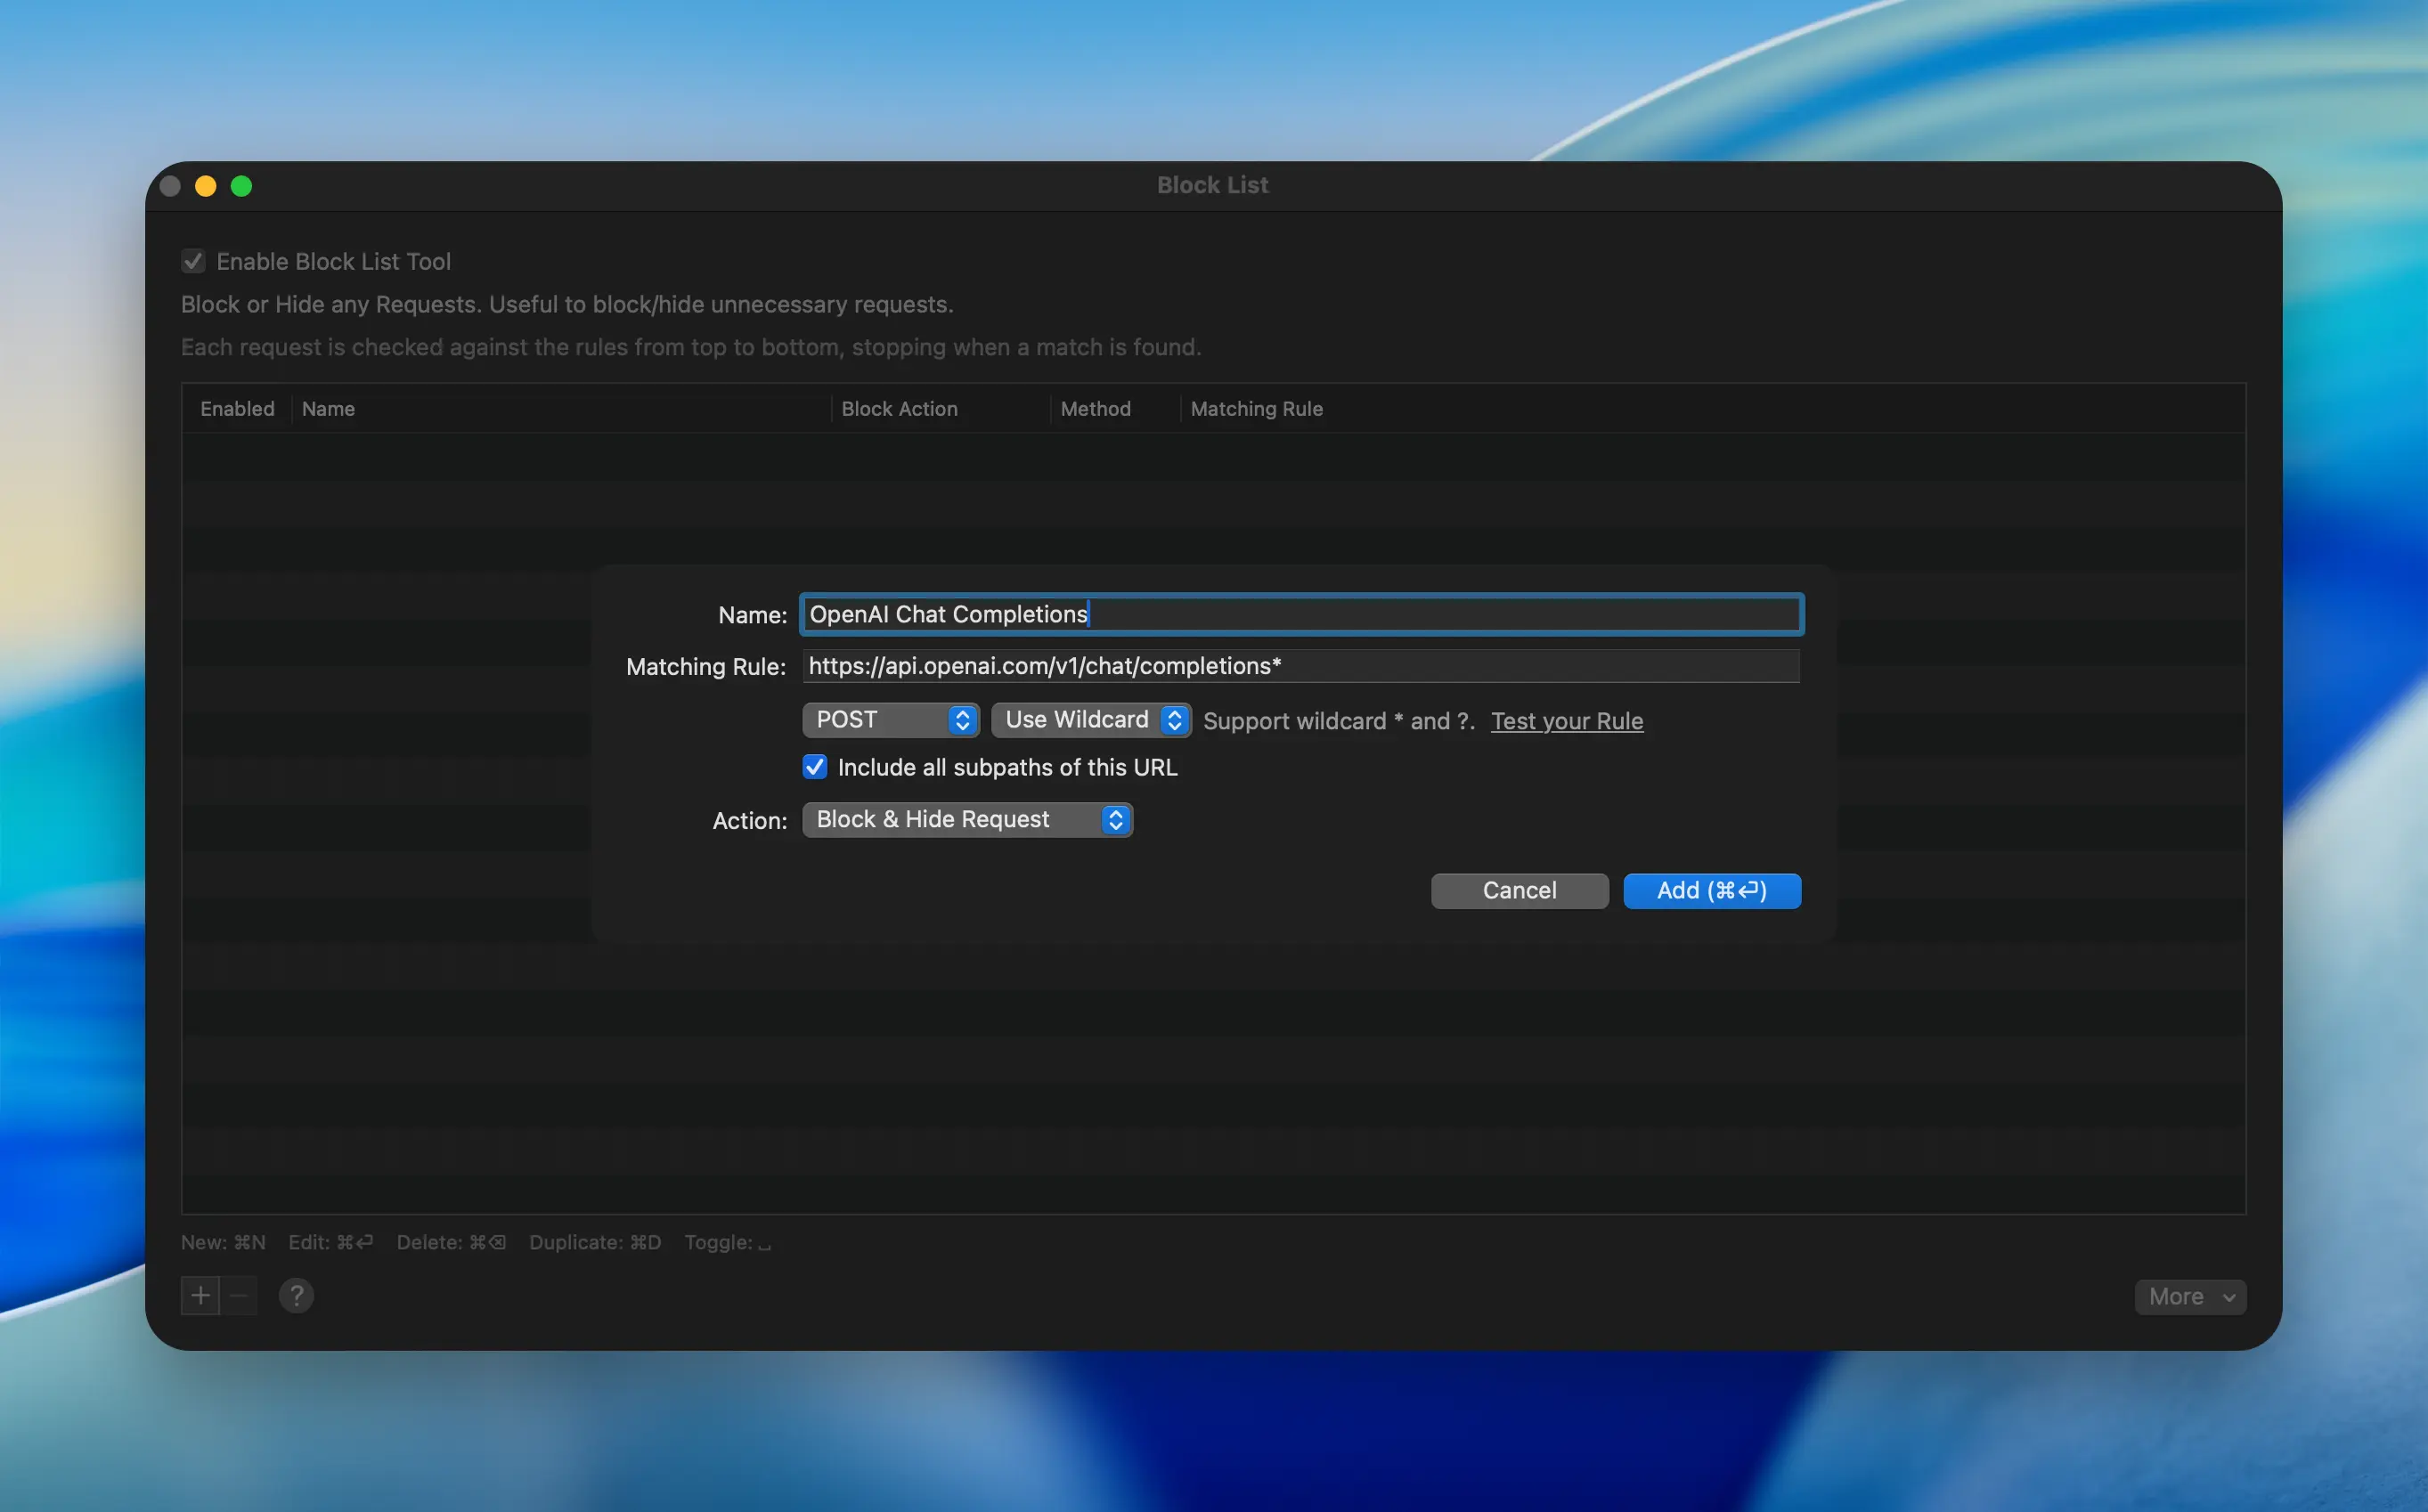
And, immediately as I pressed the ‘Translate All’ button, the app crashed 💥. After being able to reproduce the crash, I soon realized that the crash happened when presenting our custom Toast Error view and, as it was slotting itself in a HStack with not enough space to satisfy its constraints.
I instead turned it into an overlay, guaranteeing no interference with the layout and the app was able to present the view without crashing:
Bug 2: Performance Regressions
A while ago, we noticed that one of the views in our app was taking longer to load than it was doing in previous versions. While it is inevitable that your app grows and becomes more complex as you add more features, it is important that the performance impact these features have on the app is minimal.
The view that was the performance regression was also arguably the most important one: the version view. This app makes a bunch of concurrent network requests to retrieve all necessary information and it is supposed to perform them all in parallel to ensure the user sees the most up to date information as soon as possible.
The first thing I did was to use the Time Profiler template in Xcode’s Instruments to see where the time was being spent:
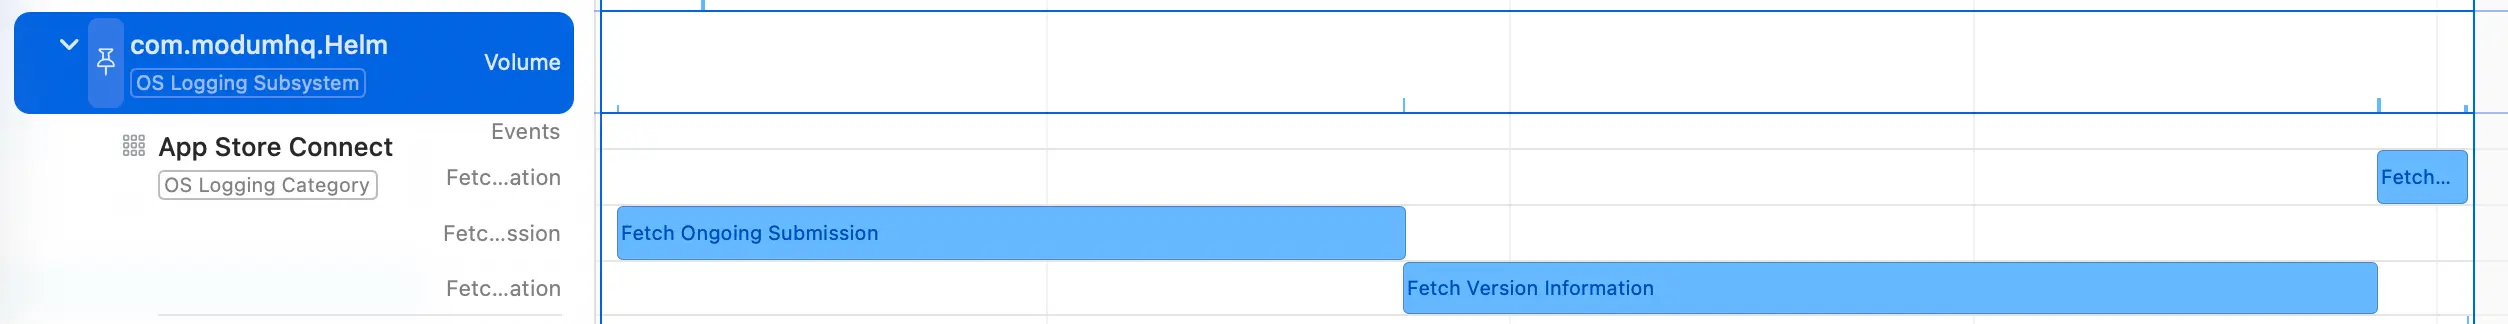
After profiling the app, it became very obvious to me that some of the network requests were happening serially when they should have been happening in parallel. This caused the extra loading times.
At this point, I turned to the codebase to fix the issue using structured concurrency. I went from this code that runs every async task serially:
let submission: Void = await SubmissionManager.shared.setup(for: app, platform: version.platform)
let versionInfo = try await app.getInformation(
    forVersion: version,
    otherPlatforms: app
        .availableVersions
        .reduce(into: [AvailableVersion](), { partialResult, iteratorVersion in
            guard version != iteratorVersion, iteratorVersion.platform != version.platform else { return }
            if !partialResult.contains(where: { $0.platform == iteratorVersion.platform }) {
                partialResult.append(iteratorVersion)
            }
        })
)
let updatedApp: AppStoreConnectApp? = try await {
    guard self.appID != app.id || forceRefresh else { return app }

    return try await store.getApp(byID: app.id, forceRefresh: true)
}()
To this code that runs them all in parallel:
async let submissionsRequest: Void = SubmissionManager.shared.setup(for: app, platform: version.platform)
async let appInformation = try app.getInformation(
    forVersion: version,
    otherPlatforms: app
        .availableVersions
        .reduce(into: [AvailableVersion](), { partialResult, iteratorVersion in
            guard version != iteratorVersion, iteratorVersion.platform != version.platform else { return }
            if !partialResult.contains(where: { $0.platform == iteratorVersion.platform }) {
                partialResult.append(iteratorVersion)
            }
        })
)
async let refreshedAppInfo: AppStoreConnectApp? = {
    guard self.appID != app.id || forceRefresh else { return app }

    return try await store.getApp(byID: app.id, forceRefresh: true)
}()

let (versionInfo, updatedApp, _) = try await (appInformation, refreshedAppInfo, submissionsRequest)
As it is the case in this example, most of the time is usually spent looking for the issue rather than fixing it. That’s why it is so important to know how to use the tools to make the process of finding the bug as efficient as possible.
Bug 3: Unexpected System Prompts
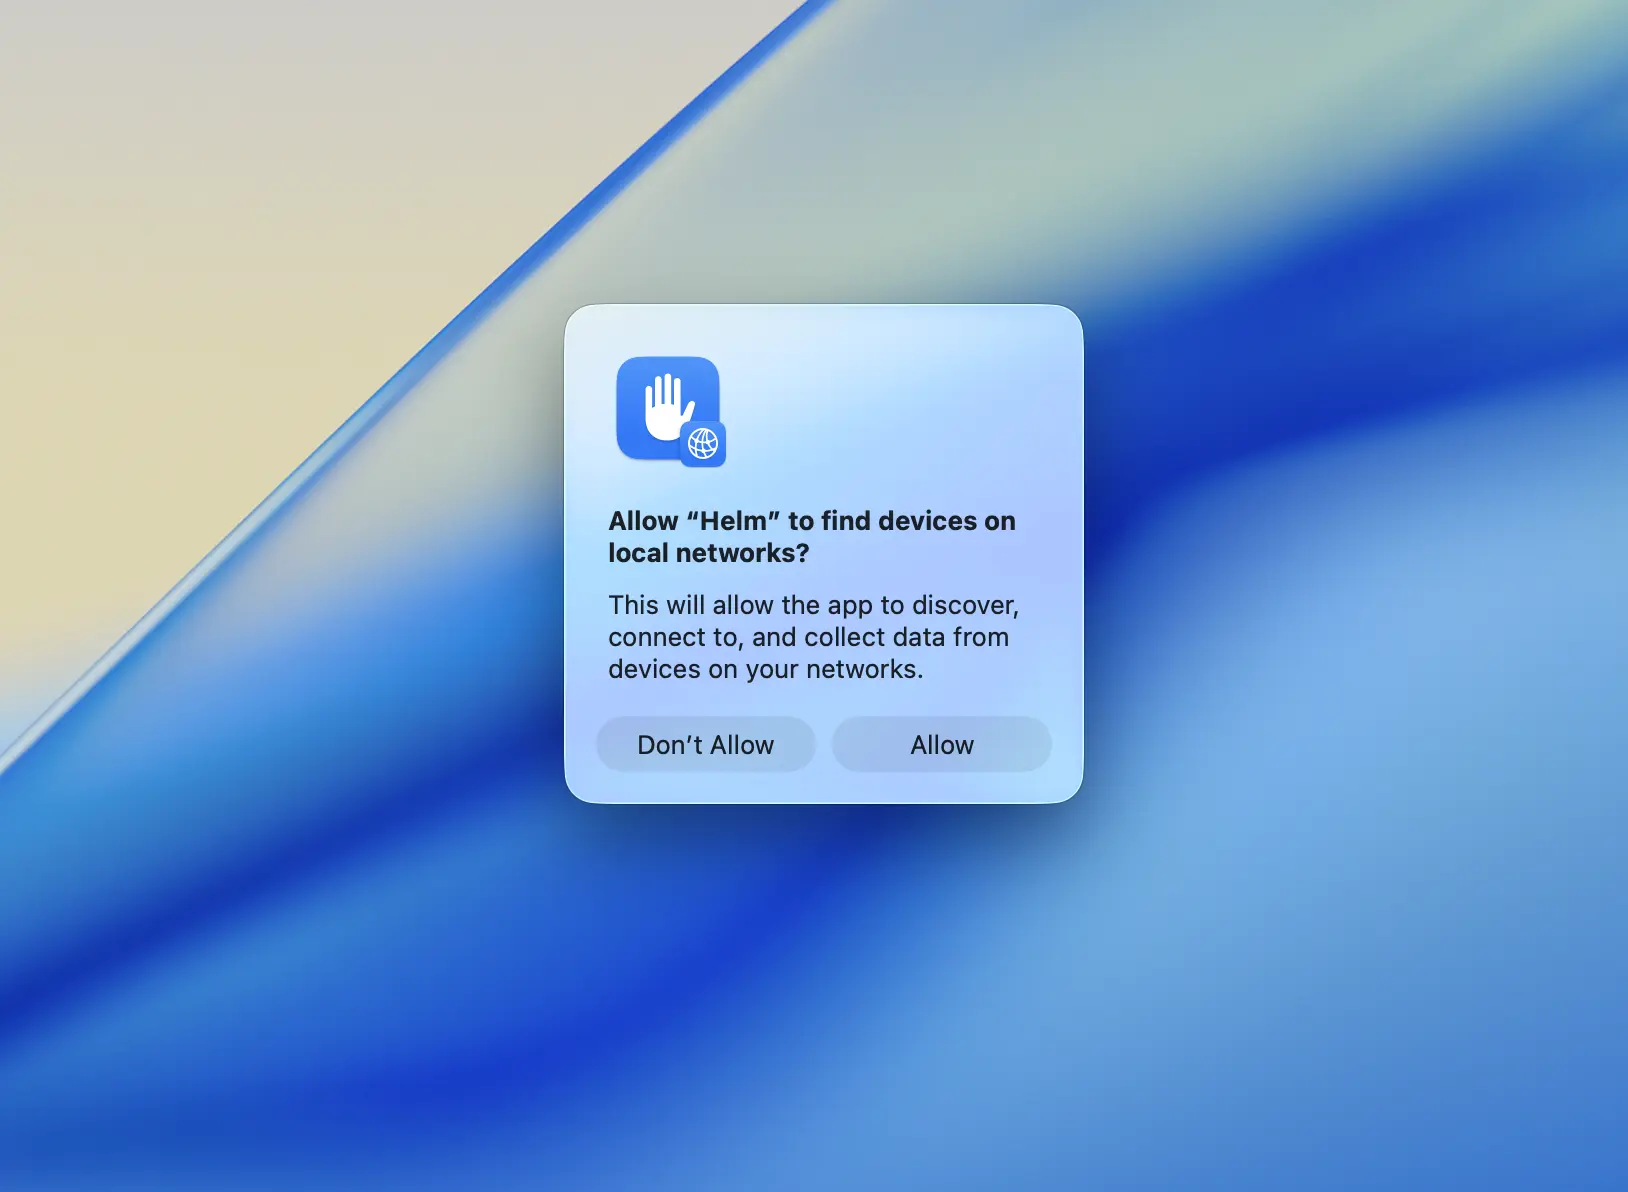
This was definitely one of the most challenging bugs I have had to fix in a while. One of our users reported that the app was presenting a system prompt to access local devices on their network as soon as they opened the app. This report surprised us, as we do not try to access any local networking features in the app and hence we did not want to ask the user for permission to do so. This would cause unnecessary friction and a bad first impression:
For this reason, I kicked off an investigation to see if we could find why Apple thought our app was trying to access features that required such permissions. And here’s where the story got interesting:
- The alert would only ever show up once on device and, on macOS, this setting is not resettable. As you can imagine, reproducing this was a nightmare, I had to keep restarting my machine to trigger the alert to show.
- There is no logs or specific information in the console to help me understand why the alert was showing up.
- Third-party libraries could be the culprit, and, as we use a few, there was a lot of code to go through.
One thing that we knew was that the prompt was being presented at app start up, so it was very likely that the method causing the prompt to show was being called in the initializers of our app struct. This information gave me a very solid starting point and turned out to be crucial in finding the root cause of the issue.
This is everything we initialize when our app starts up:
@main
struct HelmApp: App {
    // ...
    init() {
        do {
            try DiagnosticsLogger.setup()
        } catch {
            ErrorLogger.log("Failed to setup the Diagnostics Logger", for: .generic)
        }
        AIProxy.configure(
            logLevel: .debug,
            printRequestBodies: false,
            printResponseBodies: false,
            resolveDNSOverTLS: true,
            useStableID: true
        )
        HelmProManager.configureRevenueCat()
        let config = TelemetryDeck.Config(appID: Keys.telemetryDeckAppID)
        TelemetryDeck.initialize(config: config)

        NSWindow.allowsAutomaticWindowTabbing = false
        validator = AppStoreAPI.shared
        helmPro   = HelmProManager.shared
        let versionHistoryManager = VersionHistoryManager(storage: StorageManager.history)
        versionRefresher = VersionsRefresher(versionHistoryManager: versionHistoryManager)
        store = Store()
    }
}
The first thing I did was to comment out everything in the init() method to confirm that it was indeed one of these calls that was causing the prompt to show up. After commenting out everything and running the app again, the prompt was no longer showing up. I then started to uncomment the calls one by one until I found which method was accessing the local networking features.
Once I had identified the method that caused the issue, I investigated what internally was happening to trigger the prompt to show up. As remote SPM dependency files are not editable directly in source, I cloned the repository and replaced the remote Swift Package with the newly cloned one.
This pattern has helped me a lot in the past and it provides a very easy way to debug and understand issues with third-party libraries. Once I had the local copy of the package, I repeated the same process as before: I commented out everything in the library’s code and added logic little by little until the prompt showed up again. And finally, I was able to identify the exact piece of code that triggered the prompt to show up:
enum Device {
    static var systemName: String {
        #if os(macOS)
        // 😱 This is the culprit line!
        return ProcessInfo().hostName
        #else
        return UIDevice.current.systemName
        #endif
    }
}
We fixed it by forking the library and replacing the code above with a different implementation to get a release out as soon as possible and we notified the library’s maintainer of the issue, so that it could be fixed in an upcoming release.
While the process of identifying the cause of this bug was not the most glamorous, some bugs only require some good old fashioned print statements, comments and a good deal of patience.
Final thoughts
Debugging is an essential skill that every developer should master. The three examples I’ve shared demonstrate that different bugs require different approaches and tools:
- Crashes often require analyzing stack traces, using diagnostic tools like Diagnostics, and network debugging tools like Proxyman
- Performance issues can be efficiently identified using Xcode Instruments and most often fixed with proper understanding of Swift language features such as structured concurrency.
- Mysterious system behaviors might be the trickiest to fix and will often require systematic elimination and patience to track down third-party library issues
The key takeaway is that knowing your tools and having a systematic approach to debugging will save you countless hours. Whether it’s crash logs, profiling tools, or good old-fashioned commenting out code, the right tool for the right job makes all the difference.
Remember: most debugging time is spent finding the issue, not fixing it. Invest in learning your debugging tools well—it’s time that pays dividends throughout your entire development career.