How to build segmented circular progress views in SwiftUI with Swift Charts
Go from confusion to confidence with a step-by-step Swift Concurrency course, helping you smoothly migrate to Swift 6 and fully leverage its features.
We have recently added the ability to manage your app’s phased releases in Helm. The feature allows you to see the progress of the 7-day rollout of your app’s new version as well as pausing or resuming the roll-out and even releasing the version to all users at any time.
As part of this work, we built a custom segmented circular progress view using Swift Charts that we would like to share with you in this article:
How we built it
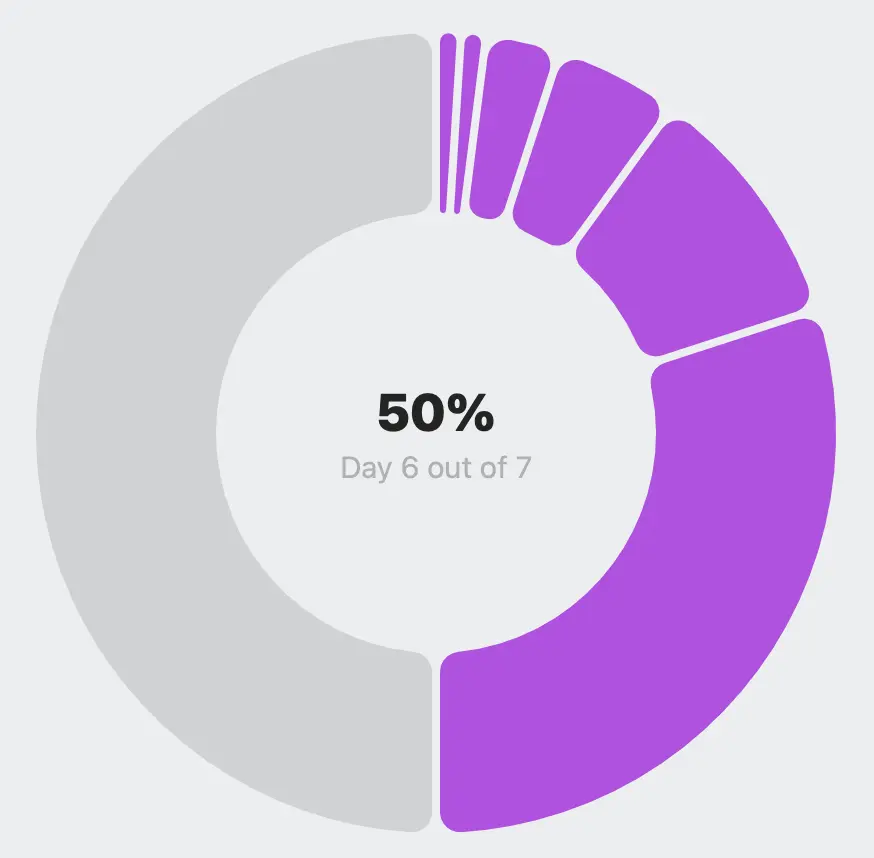
As you can see, the image above shows a circular view with 7 segments, each representing a day of the rollout. The segments occupy a portion of the circle’s circumference proportional to the percentage of users receiving the update on that day.
One thing we noticed when we started building the component was that it could be represented with a pie chart, so we decided to reach for the Swift Charts library to help us with the task.
Modeling the data
The first step was to come up with a data model that would represent the pie chart segments. This could be as simple as a one-dimensional array of structs holding the global percentage of the rollout, the day number and the rollout increase (between 0 and 1) for that day.
import Foundation

struct ProgressPortion {
    let day: Int
    let portion: Double
    let rolloutPercentage: Int
}
Building the chart
Now that the data model was in place, we needed to build the chart view itself using Swift Charts. In the center of the chart, we also display the current day number and the total rollout percentage.
import SwiftUI
import Charts

struct PieChartProgressView: View {
    // 1
    let portions = [
        ProgressPortion(day: 1, portion: 0.01, rolloutPercentage: 1),
        ProgressPortion(day: 2, portion: 0.01, rolloutPercentage: 2),
        ProgressPortion(day: 3, portion: 0.03, rolloutPercentage: 5),
        ProgressPortion(day: 4, portion: 0.05, rolloutPercentage: 10),
        ProgressPortion(day: 5, portion: 0.1, rolloutPercentage: 20),
        ProgressPortion(day: 6, portion: 0.3, rolloutPercentage: 50),
        ProgressPortion(day: 7, portion: 0.5, rolloutPercentage: 100)
    ]

    // 2
    let day: Int

    var body: some View {
        // 3
        if let rollout = portions.first(where: { $0.day == day })?.rolloutPercentage {
            // 4
            ZStack(alignment: .center) {
                // 5
                VStack {
                    Text("\(Int(rollout))%")
                        .font(.largeTitle)
                        .fontWeight(.heavy)
                        .foregroundStyle(.primary)
                    Text("Day \(day) out of 7")
                        .font(.title3)
                        .foregroundStyle(.tertiary)
                        .lineLimit(1)
                        .minimumScaleFactor(0.5)
                        .padding(.horizontal)
                }

                // 6
                Chart(portions, id: \.day) { element in
                    // 7
                    SectorMark(
                        angle: .value("Phased Release Progress", element.portion),
                        innerRadius: .ratio(0.55),
                        angularInset: 2
                    )
                    .cornerRadius(10)
                    // 8
                    .foregroundStyle(day >= element.day ? .purple : .gray.opacity(0.3))
                }
            }
            .frame(width: 250, height: 250)
        }
    }
}
Let’s break down the code above into smaller parts:
- We define an array of
ProgressPortionstructs that represent the rollout progress for each day. - We define the current day as a property so that we can inject it into the view.
- We check if the current day is present in the
portionsarray and extract the rollout percentage. In other words, we only show the chart if the current day is within the rollout period. - We create a
ZStackto overlay the chart with the current day and rollout percentage. - We display the current day and rollout percentage in a
VStack. - We create a
Chartview instance with theportionsarray. - For each portion, we create a
SectorMark, which is a piece of the pie chart with the day rollout value. - We set the foreground color to fill all days before the current day with purple and the rest with gray.